Visualizing speech with speech embeddings
July 20, 2021
Code
Facebook's Wav2Vec2 models the structure of speech pretty well. It seems to have learned interesting features which I started exploring earlier.
It turns out that Wav2Vec2 can model speech by breaking each chunk of audio (50ms long) into a pair of discrete codes. For example, a chunk of speech could be assigned the codes . The authors found that having two codebooks of 320 items each gave good performance. Given that the model can transcribe speech and predict missing codes from context, it's not a leap of logic to think of its discrete codes as a kind of phonetic alphabet: one dervied from lots of data and signal processing.
We can also think of these discrete features as just another tool in a large toolbox of signal processing techniques, and by combining a handful of factors that we care about, it's possible to create pretty interesting visualizations of speech that wouldn't have been possible before. Here are some factors that we'd expect from a good visualization of speech:
- volume (moving average of signal's amplitude)
- dominant pitch (center of mass after short-term Fourier transform)
- phonetic content (features from Wav2Vec2)
- language content
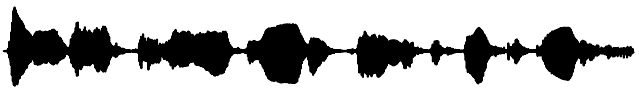
Each of these factors can be visualized in a fairly intuitive way. In a normal waveform, the relative volume is shown by the height of a signal:
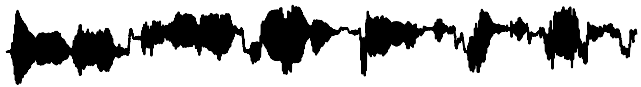
We can also do a short-term Fourier transform to extract frequency information at smaller chunks of the signal. The center of mass of the frequencies could be considered the dominant pitch. An intuitive way to visualize this would be to shift the entire waveform up or down depending on the dominant pitch:
While these techniques accomplish what we want, the visualizations feel trivial. And the waveform still feels very opaque.
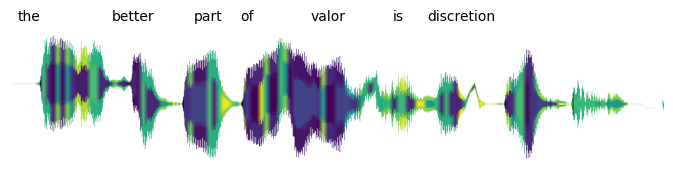
What really surprised me is what we can do when we include the phonetic content from Wav2Vec2:

Suddenly the waveform doesn't feel opaque anymore, and we can see hints of its structure. Some sections are clearly different from others.
But where did the colors come from? There's nothing in Wav2Vec2 that tells us about the "color" of a sound. We could pick any color system for the visualization. For example, this also works:

We get the colors from dimensionality reduction. It would be difficult to visualize the codebook entries as vectors because they contain a lot of information: each one is represented as 384 floating point values. But because there are only 320 codes per codebook, we could think of dimensionality reduction as translating each code to one of 320 colors. We can use a continuous colormap to represent similarity: similar codes map to similar colors. Given a spectrum of colors, dimensionality reduction can assign a color to each code:

Finally, we can align the transcripts to the audio:
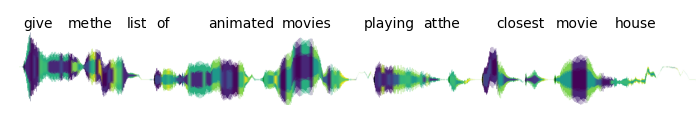

Notice that each chunk of audio has two colors — this is one color per codebook. I put one in the center and one on the edges because it felt the best visually. But of course, we could also visualize the same information by splitting the waveform horizontally:

While this experiment was motivated mostly by artistic reasons, I also believe that this line of thinking could end up being more practical. For example, similar visualizations may be very useful for language learners to see alongside the transcripts of audio that they're listening to. There are tools that represent the frequency information of speech, which are helpful for tonal languages like Mandarin, but none that unify features like pitch, volume, and phonetic information. The visualizations may also be useful to speech-language pathologists: there could be benefit from visual feedback for i.e. articulating phonemes. It could also simply be fun to see your speech move across the screen like a paintbrush. :)